

The Gap Between Analysis and Allocation for Family Offices

Three of the world’s largest private banks surveyed over 800 family offices this year and there’s one major underlying trend across the research. There’s a measurable gap between what these institutions say they believe and where their money actually went.
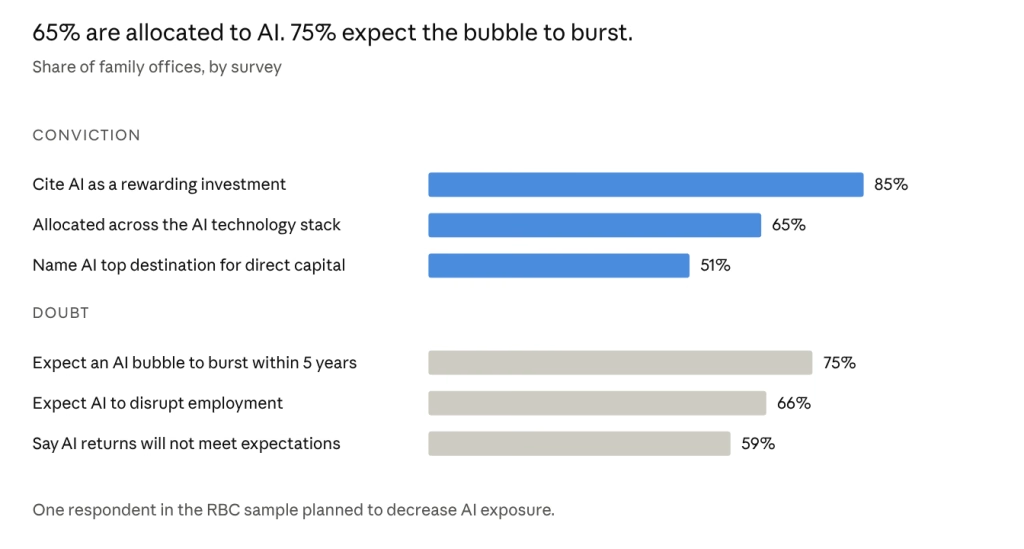
They know believe AI is a bubble. They are buying it anyway.
It’s no surprise artificial intelligence was a strong topic.
UBS found 65% of family offices allocated across the AI technology stack, broader participation than any other theme in its survey. Citi found 51% naming AI as the primary destination for new direct-investment capital, well ahead of healthcare at 32% and real estate at 31%; in Asia Pacific that figure reached 80%. RBC and Campden’s North American sample ranked AI first over a 12-month horizon and second only to US equities over two to five years, cited by a combined 85% of offices.
When asked what could go wrong, seventy-five percent of respondents expect an AI investment bubble to burst within the next five years. Sixty-six percent expect AI to disrupt employment. Fifty-nine percent agree that returns on AI investments will not meet current expectations.
Despite this, exactly one respondent planned to decrease AI exposure. One.
This is not a failure to perceive risk. The bear case has been articulated with precision. One CEO presents it plainly: “Family offices are frightened of missing out, so they are investing in both rival AI ecosystems that are developing in the US and China.” UBS puts the same thing in its own key findings, attributing the pattern to long-term conviction “as well as fear of missing out.”
The charitable reading is that both positions can hold at once. A bubble can burst and the underlying technology can still compound for decades. An institution with a genuine multi-decade horizon can rationally sit through a severe drawdown and downturn that a fund with quarterly reporting cannot. The less charitable reading is that 75% is just reputational insurance. A hedge against being wrong in public rather than a position actually being taken or one anyone has actually sized for.
It is worth noting where the money is flowing. Roughly half of UBS’s AI-allocated offices hold data center infrastructure, AI software platforms and semiconductor producers: the build-out rather than the applications. Adjacent themes follow the same logic, with power and resources at 37% and infrastructure at 37%. Capital is going to the parts of the trade with physical collateral underneath, which is itself a quiet statement about how much of the thesis anyone fully believes.
They said they were leaving the dollar. They went deeper in America.
Start with the stated position, which is emphatic. UBS found 65% of family offices expect confidence in the dollar’s reserve role to weaken over the coming year, against 6% expecting it to strengthen. The dollar is the only major currency where a substantial share, to the tune of 47%, describe themselves as over-exposed. 29% have already reduced or are considering reducing exposure to dollar-denominated assets. The Swiss franc and the euro are the named alternatives. Reading UBS alone, you would conclude a reallocation away from US assets is underway.
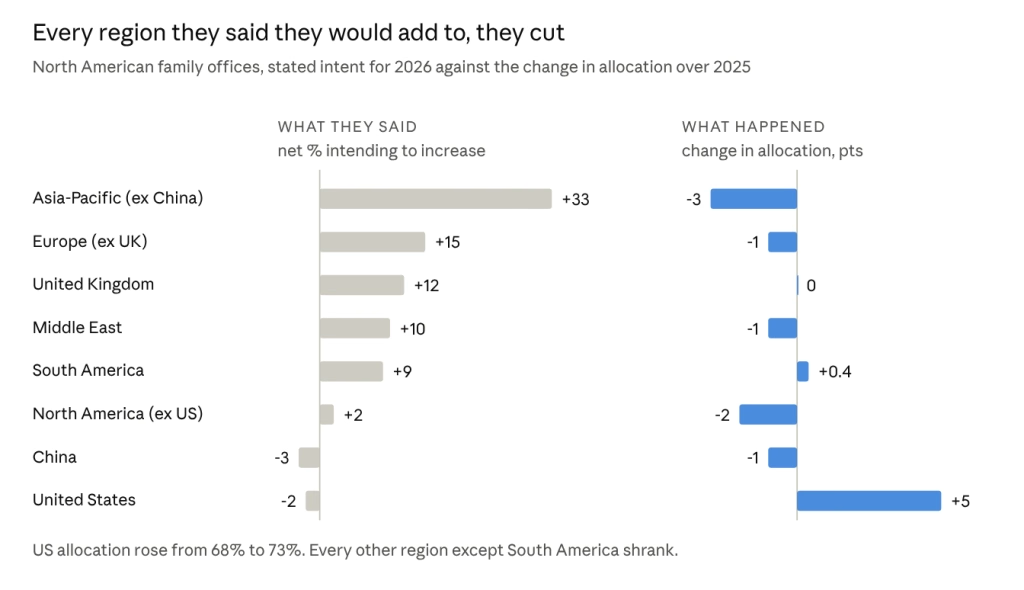
Now the behavior. RBC and Campden asked North American offices last year where they intended to add exposure, and more of them named Europe and Asia-Pacific than named the United States. What happened instead was the reverse. The average US allocation rose from 68% to 73%. Nearly every non-US region shrank. South America was the sole exception, and it rose by four tenths of one percentage point.
Strong US equity performance explains part of the move, but “there also appears to be a deliberate decision not to rebalance.” Offices then stated the same intentions again this year. Intentions that have rightfully been met with skepticism.
With a more global lens, Citi’s surveying shows where the money went. North America is the most favored region for incremental capital, with 39% increasing allocations against 6% decreasing. No other region comes close. UBS’s own data contains the same fact in its geographic breakdown: its US respondents hold 88% of assets at home.
So the three reports, measuring three different things, produce one coherent picture. Family offices hold a sincere and well-reasoned view that they are over-concentrated in dollar assets. They can name the risks, name the preferred alternatives, and quantify their own discomfort. And over the twelve months in which they held that view, they increased their US exposure by five percentage points.
The chart below paints the picture perfectly for what North American offices said they intended to do vs what their allocation actually did. The regions that attracted the most positive intent are the ones that lost the most ground.
They said they were patient capital. Then they wanted liquidity.
Patience is typically seen as a family office competitive advantage, and the data supports it, to a point. Citi found that 72% of offices will not reassess strategy until a portfolio drawdown exceeds 11%, a real structural edge over any manager facing redemptions.
RBC quantified what happens when patience meets an actual liquidity event. Nearly one in five private-market investors attempted to exit a fund position this year. Of those who tried, 47% could not complete the exit as expected and half ran into caps or restrictions. While the base is small, only fifteen offices, the consequences aren’t.
Sentiment on entry pricing collapsed in tandem. Last year 28% of offices agreed that private equity EV/EBITDA multiples represented an attractive entry point. This year 14% agree and 40% disagree. 68% percent expect a high-profile private credit event within the year, which Citi corroborates from the other direction: its respondents plan to reduce private credit exposure, against a backdrop of defaults the report puts at a record 6%.
Portfolio construction is shifting. Direct investments went from 33% to 45% of the average North American private-markets book in a single year, while funds fell from 48% to 36%. Co-investments held at 10%. Secondaries and funds-of-funds sit at roughly 5% each. Citi’s global figures point the same way: 75% of offices invest directly, 40% expect to increase that activity against 8% decreasing.
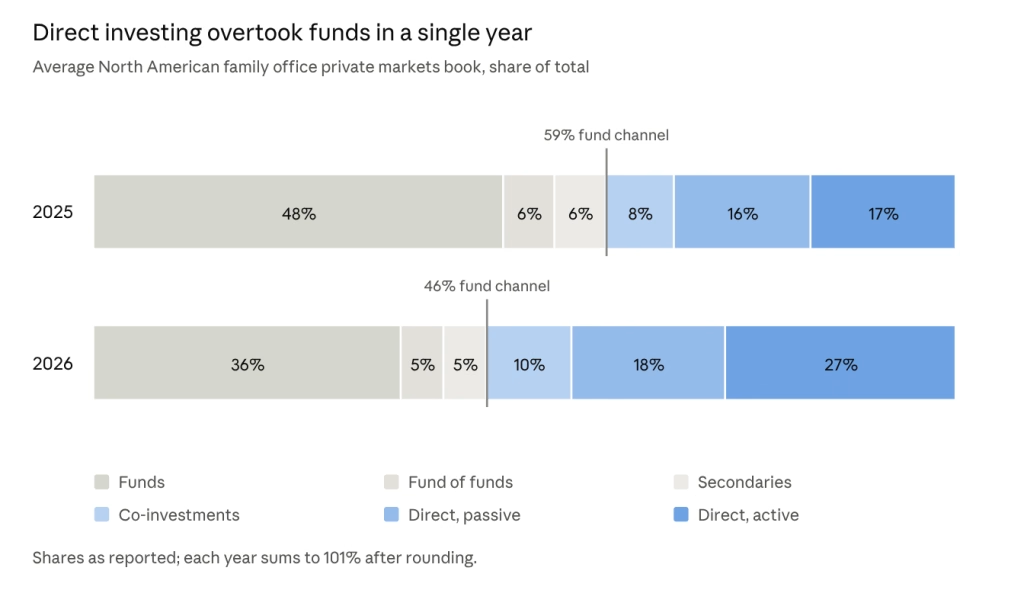
This is usually reported as enthusiasm for direct investing, but sequence suggests institutions got a closer look at what their true liquidity actually looked like and didn’t care for the view. Patience may be wearing thin.
Which raises the question nobody in these reports answers comfortably. Direct investing demands sourcing, underwriting and execution capability that fund investing outsources by design. Citi’s data shows that reliance on outside advisors falls as offices grow, from 42% at the smaller end to 33% above $500 million, and that 69% now treat their in-house team as the primary source of deal flow. The offices moving fastest into direct are the ones least likely to bring in outside help, despite most not being equipped to choose.
It Wasn’t All Harmony Across the Reports.
Ask what family offices fear most and you get three answers. Citi says inflation, cited by close to two-thirds of its respondents and leading every other risk by a wide margin. UBS says major geopolitical conflict at 64% over twelve months and a debt crisis at 56% over five years, with inflation a distant 36%. RBC says excessive government borrowing at 76% and the AI bubble at 75%.
Citi asked an open question about the next twelve months and did not offer sovereign debt as a standalone option; its sample also carries a 17% Latin American weighting, where inflation concern runs at 76%. UBS split the question across two horizons and found that the ranking inverts depending on which one you ask about. The practical consequence is that the widely repeated claim that inflation is the top family office concern is a product of one survey’s question design. Debt sustainability is the better-corroborated answer.
The same thing explains the apparent contradiction on portfolio activity. Citi describes surgical adjustment and notable calm, with 41% making no change at all in response to Middle East volatility, rising to 60% in North America. UBS reports that 60% of family offices plan to change their strategic asset allocation over the coming year, the highest figure in the seven-year history of its report and up from 35%.
Both are correct. Citi asked what offices did over the last twelve months. UBS asked what they intend to do over the next twelve. One survey captured behavior and the other captured intent, and the gap between the two numbers is how we ended up here.
So what knowledge sits in this gap between analysis and action for family offices?
Stated intent is a weak forecast of capital flows. RBC’s regional data contains a documented instance of intent failing to predict behavior at the twelve-month horizon, with the direction reversed. Anyone sizing a fundraise, a syndication or a market-entry thesis off survey intent data is building on the softest number in the set.
Revealed allocation is the signal worth tracking. The 68% to 73% move tells you more about where family offices are allocating capital than any question about preference, and it is the number that took a year to produce. The same logic applies to a single counterparty: what they funded last year is likely better evidence than what they say they are looking for now.
The gap is widest where capital is least liquid. Offices reallocated toward public equities and direct deals, both of which they control the timing of. They did not act on the dollar view, which would have required selling appreciated positions, and they did not act on the AI view, which would have required calling a top. Where acting on a stated view is cheap, they act. Where it is expensive, the view stays just that, a view.
The capability gap is the live risk. The structural change with the clearest evidence behind it is the shift from funds to direct, and it is happening fastest among institutions that are simultaneously reducing their reliance on outside underwriting help. Logically, this creates somewhat of an impasse, and it’s reasonable to assume that a more significant shift to in-house expertise is coming.
Sources and methodology
Unless otherwise stated, the stats and figures above represent cumulative findings across all three primary reports. Each is a survey of its own sponsoring bank’s client base, self-selected and self-reported, with respondents differing year to year. Findings that converge across all three are treated here as reliable; single-source figures are labeled as such.

Key Takeaways from Axial’s 2026 Independent Sponsor Report
Are you positioned to win? Find out.
 English